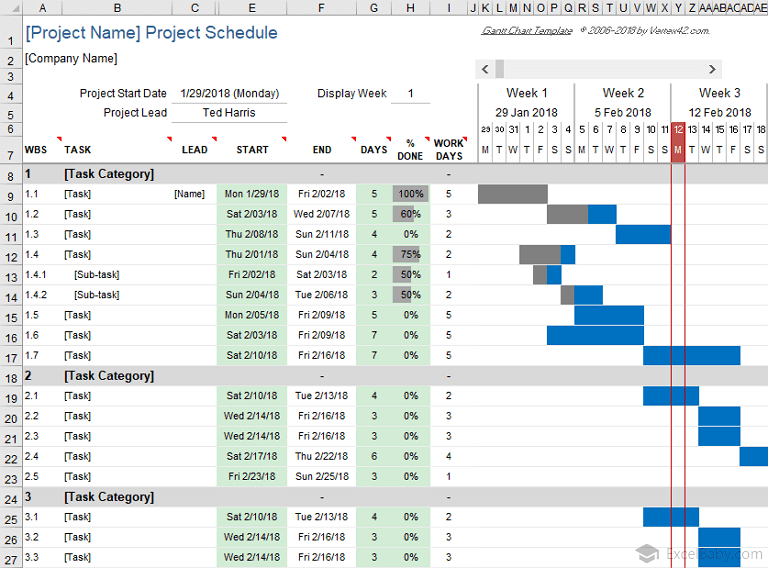
This template contains the core functionality needed to create a simple Gantt chart easily. Each row of the worksheet represents a separate task. All you need to do is define the start date and duration of each task.
- To add more tasks, you just copy and paste rows (or insert a row then press Ctrl + D to copy formulas down).
- To change the range of dates displayed in the chart area, just slide the scroll bar.
- To track the status of a task, edit the % Complete column. The bars in the chart show the % complete for each task.
- The vertical red line shows the current date.
- To use the automatic work breakdown structure numbering, copy the formula for the appropriate level from the bottom of the worksheet.
"No installation, no macros - just a simple spreadsheet"
Apply to
Excel 2003 and later, Google Sheets, OpenOffice
Supported language
English
License
Private Use (not for distribution or resale)
Download
Old Design
Old Design: Excel 2010 or later (.xlsx)
New Design
This download provides the same functionality as the original free Gantt chart template above. The main difference is the formatting. The WBS, End, and Work Days columns are highlighted gray to indicate that they contain formulas.
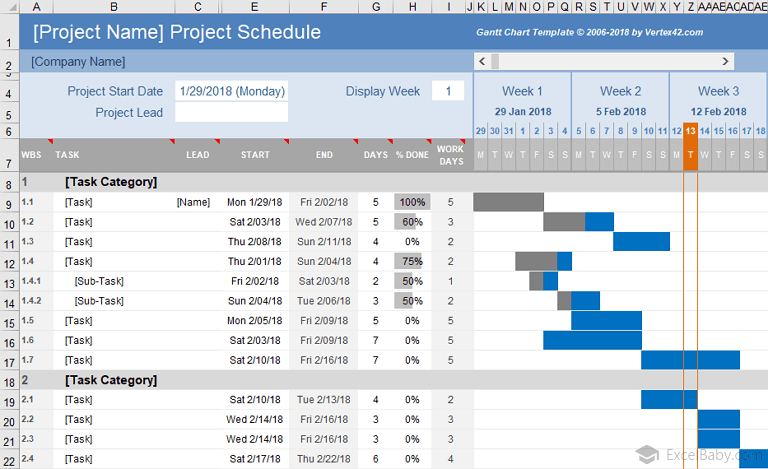
New Design: Excel 2010 or later (.xlsx)