Nightingale Rose Diagram is the most famous statistical diagram. It's a form of the Pie Chart now known as the Polar Area Diagram. We often see it in the Business Magazines, Newspapers and Journal of Finance. In this tutorials, I'll show you two styles of Nightingale Rose Diagram Template use Excel VBA.
Nightingale Rose Diagram Template Style 1
Final results
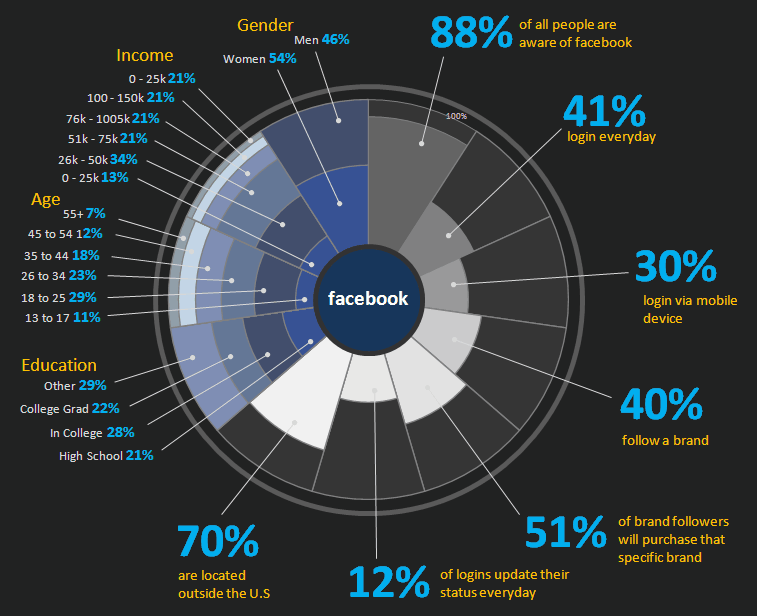
Nightingale Rose Diagram Template 1
Very cool? Yes! In this style, we use Facebook social demographics 2010 data. You can compare this diagram with Digital Surgeons's post.
VBA Code
Sub RoseDiagram1()
    Dim i%, j%, k%, n%, m%
    Dim arr
    Dim MyShapes() As Variant
    Dim ObjRange As Object, ObjShape As Object
    Dim MaxRow As Integer
    Dim MaxCol As Integer

    On Error Resume Next
    ActiveSheet.Shapes("group1").Delete
    Erase MyShapes
    Application.ScreenUpdating = False
    arr = ActiveSheet.Range("A1").CurrentRegion
    MaxRow = UBound(arr, 1) - 1
    MaxCol = UBound(arr, 2)
    ReDim MyShapes(1 To MaxCol * MaxRow)
    n = 1

    For i = 1 To MaxCol
        j = 17
        Do While Cells(j, i) <> ""

            Set ObjShape = ActiveSheet.Shapes.AddShape(msoShapePie, 400, 700, 150, 150) 'You may change the shape parameters
            With ObjShape
                .LockAspectRatio = msoTrue
                .Fill.ForeColor.RGB = Cells(j, i).Interior.Color
                .Line.ForeColor.RGB = RGB(128, 128, 128) 'You may change the line forecolor
                .Line.Weight = 1
                .Line.Visible = msoTrue
                .Adjustments.Item(2) = 360 / MaxCol - 90
                .Adjustments.Item(1) = -90
                .Rotation = 360 / MaxCol * (i - 1)
                .ScaleHeight (0.4 + Cells(j, i)) / 0.7, msoFalse, msoScaleFromTopLeft
                For k = 1 To j - 1
                    .ZOrder msoSendBackward
                Next
            End With
            MyShapes(n) = ObjShape.Name

            n = n + 1
            j = j + 1
        Loop
    Next
    n = n - 1

    Set ObjShape = ActiveSheet.Shapes.AddShape(msoShapeFlowchartConnector, 400, 700, 320, 320) 'You may change the shape parameters
    With ObjShape
        .Line.ForeColor.RGB = Cells(13, 2).Interior.Color
        .Line.Weight = 4 'You may change the line weight
        .Fill.Visible = msoFalse
        MyShapes(n + 2) = .Name
    End With

    Set ObjShape = ActiveSheet.Shapes.AddShape(msoShapeArc, 400, 700, 40, 40) 'You may change the shape parameters
    With ObjShape
        .Line.ForeColor.RGB = RGB(50, 50, 50) 'You may change the line forecolor
        .Line.Weight = 4
        .Adjustments.Item(2) = -90
        .Fill.ForeColor.RGB = Cells(13, 4).Interior.Color
        .ZOrder msoSendTotop
        MyShapes(n + 3) = .Name
    End With

    Set ObjRange = ActiveSheet.Shapes.Range(MyShapes)
    With ObjRange
        .Align msoAlignLefts, msoFalse
        .Align msoAlignTops, msoFalse
        .Align msoAlignCenters, msoFalse
        .Align msoAlignMiddles, msoFalse
        .Group
        .Name = "group1"
       .ZOrder msoSendToBack
    End With

    Application.ScreenUpdating = True
End Sub
Nightingale Rose Diagram Excel Template Download
To use this template, you should have some Excel VBA knowledges. Click here to download this Excel template. (Note: support Excel 2007 - 2013)
Nightingale Rose Diagram Template 2
Final results
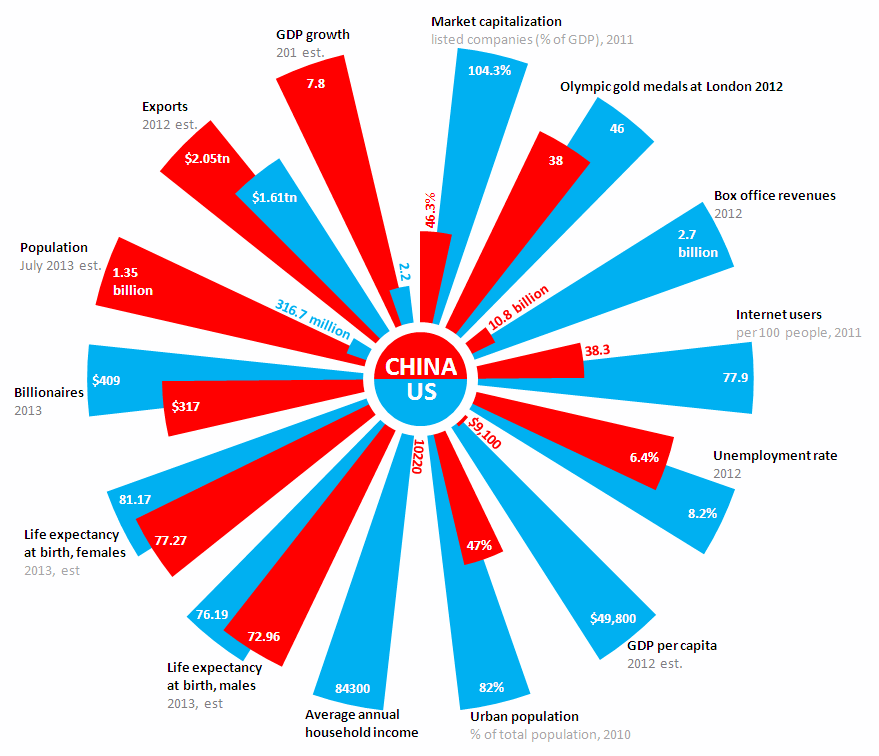
Nightingale Rose Diagram Template 2
In this style, we use China vs. US compare data to create this Rose Diagram. You can compare this diagram with here.
VBA Code
Sub RoseDiagram2()

    Dim i%, j%, k%, n%
    Dim arr, brr
    Dim ObjRange As Object, ObjShape As Object
    Dim MyShapes() As Variant
    Dim Ws As Worksheet, BName As String

    On Error Resume Next
    ActiveSheet.Shapes("group2").Delete
    Erase MyShapes
    Application.ScreenUpdating = False
    arr = ActiveSheet.Range("A1").CurrentRegion
    MaxCol = UBound(arr, 2) - 1
    ReDim MyShapes(1 To MaxCol * 2 + 3)
    n = 1
    For i = 1 To MaxCol
    For k = 6 To 7

            Set ObjShape = ActiveSheet.Shapes.AddShape(msoShapeArc, 400, 200, 250, 250) 'You may change the shape parameters
            With ObjShape
            .LockAspectRatio = msoTrue
            .Fill.ForeColor.RGB = Cells(k, 1).Interior.Color
            .Line.Visible = msoFalse
            .Adjustments.Item(2) = 360 / (2 * MaxCol + 1) - 90
            .Rotation = (360 / MaxCol) * (i - 1) + (k - 6) * (90 / MaxCol)
            .ScaleHeight Cells(k, i + 1), msoFalse, msoScaleFromTopLeft
            If Cells(k, i + 1) = 1 Then .ZOrder msoSendToBack
            MyShapes(n) = ObjShape.Name
            n = n + 1
            End With
        Next
    Next
    n = n - 1
    Set ObjShape = ActiveSheet.Shapes.AddShape(msoShapeArc, 400, 200, 43, 43) 'You may change the shape parameters
    With ObjShape
        .Adjustments.Item(2) = -90
        .Fill.ForeColor.RGB = RGB(255, 255, 255) 'You may change this
        .Line.Visible = msoFalse
        MyShapes(n + 1) = .Name
    End With
    Set ObjShape = ActiveSheet.Shapes.AddShape(msoShapeArc, 400, 200, 35, 35) 'You may change the shape parameters
    With ObjShape
        .Adjustments.Item(2) = 90
        .Fill.ForeColor.RGB = Cells(6, 1).Interior.Color
        .Line.Visible = msoFalse
        .Rotation = -90
        MyShapes(n + 2) = .Name
    End With
    Set ObjShape = ActiveSheet.Shapes.AddShape(msoShapeArc, 400, 200, 35, 35) 'You may change the shape parameters
    With ObjShape
        .Adjustments.Item(2) = 90
        .Fill.ForeColor.RGB = Cells(7, 1).Interior.Color
        .Line.Visible = msoFalse
        .Rotation = 90
        MyShapes(n + 3) = .Name
    End With
    Set ObjRange = ActiveSheet.Shapes.Range(MyShapes)
    With ObjRange
        .Align msoAlignLefts, msoFalse
        .Align msoAlignTops, msoFalse
        .Align msoAlignCenters, msoFalse
        .Align msoAlignMiddles, msoFalse
        .Group
        .Name = "group2"
        .ZOrder msoSendToBack
    End With
    Application.ScreenUpdating = True
End Sub
Nightingale Rose Diagram Excel Template Download
To use this template, you should have some Excel VBA knowledges. Click here to download this Excel template. (Note: support Excel 2007 - 2013)
Based on your code I could implement the Polar Area Chart like this:
https://dev.to/yoshio_yabusaki/how-to-implement-a-polar-area-chart-using-vba-34ji
Thank you!
NB,3Q very much!!!
is it possible to add error bars?
Hi, is there a way to add the data labels in?
@George Beniac Here you can find how to add data labels. Please have a look:
https://dev.to/yoshio_yabusaki/how-to-implement-a-polar-area-chart-using-vba-34ji
Very cool. I was looking for this. Thank you
How do I add more country in Nightingale Rose Diagram Template 2?
Thanks. It's really pretty diagram.
I need nightingale rose diagram excel download. .....Thank you....
@João here:
http://www.excelhowto.com/wp-content/uploads/2014/05/Nightingale-Rose-Diagram-Template.xlsm